NOVA graduation rates
2016-17 through 2020-21NOVA GRaduation Rates
Graduation Rates in Community Colleges
In the U.S., public two-year institutions serve about 8 million students per year, or approximately 40 percent of undergraduates. Community college students have lower graduation rates than students who start at four-year institutions. Community colleges that reform their structures and practices have improved completion rates. For example, the Accelerated Study in Associate Programs (ASAP), started at the City University of New York, combines full-time attendance, intensive advising, and financial and other supports, which nearly doubled graduation rates.1 Guided pathways reforms, which restructure the college to get students on a path in a well-mapped program of study, are also starting to show impacts on student success.2 Graduating from college with a degree or certificate can lead to greater employment opportunities and higher wages.3
NOVA and National Graduation Rates
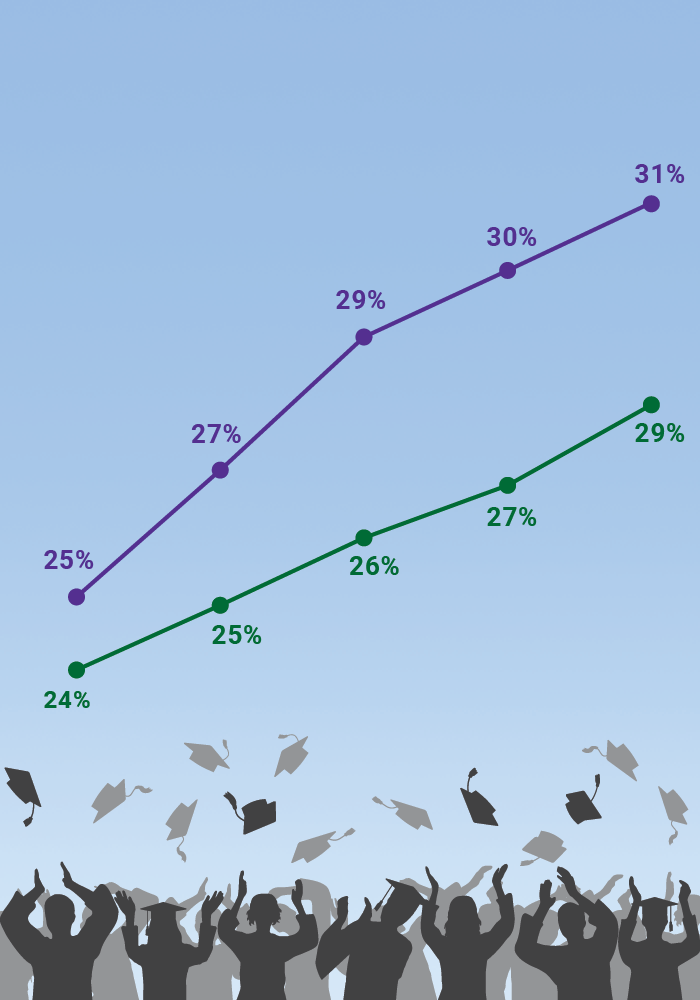
The graduation rate within 150% of normal time was 29 percent at NOVA4 and 31 percent at U.S. public 2-year institutions5 for the Fall 2017 cohort.
NOVA and National Graduation Rates
The graduation rate within 150% of normal time was 29 percent at NOVA4 and 31 percent at U.S. public 2-year institutions5 for the Fall 2017 cohort.
NOVA and National Graduation Rates
The graduation rate within 150% of normal time was 29 percent at NOVA4 and 31 percent at U.S. public 2-year institutions5 for the Fall 2017 cohort.
ANNUAL NUMBER OF NOVA GRADUATES
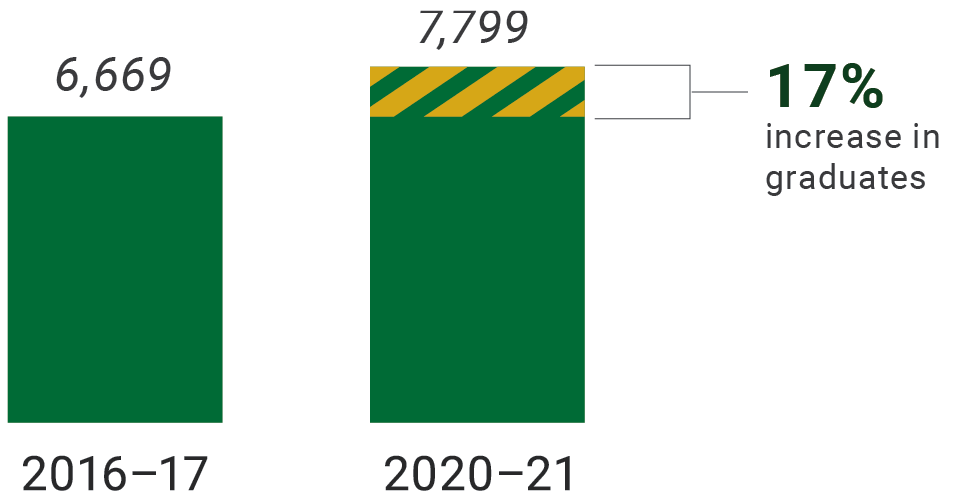
The number of NOVA graduates increased 17 percent from academic year 2016-17 to 2020-21.6
NOVA GRADUATES BY GENDER
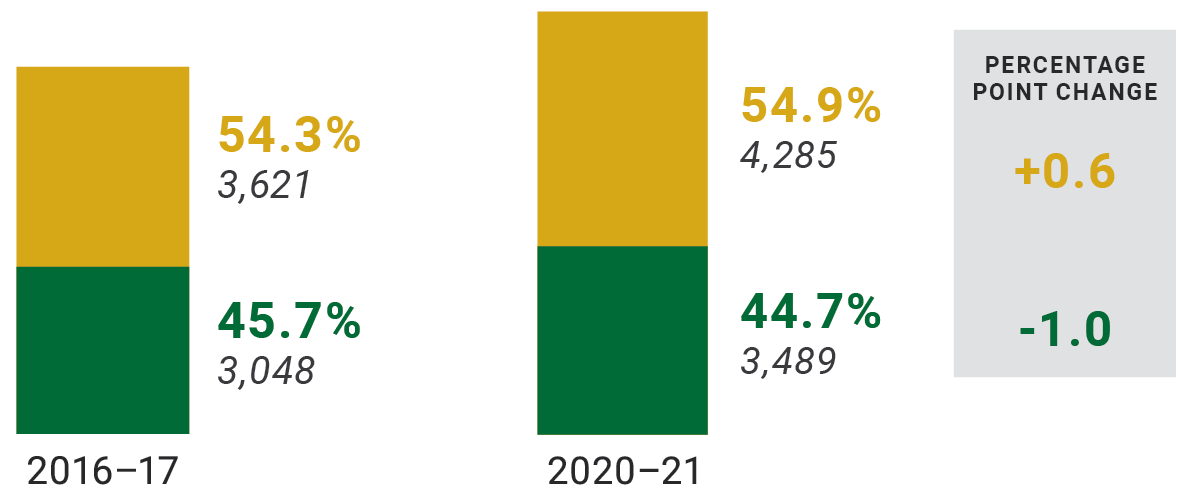
From 2016-17 to 2020-21, most graduates were female and the proportion of female graduates increased from 54 to 55 percent. The proportion of male graduates decreased from 46 to 45 percent during this period.

Female

Male
Note: The Not Specified category was added in the 2019-20 academic year. For 2020–21, this category was 0.3% of the population (25 graduates).
NOVA GRADUATES BY AGE
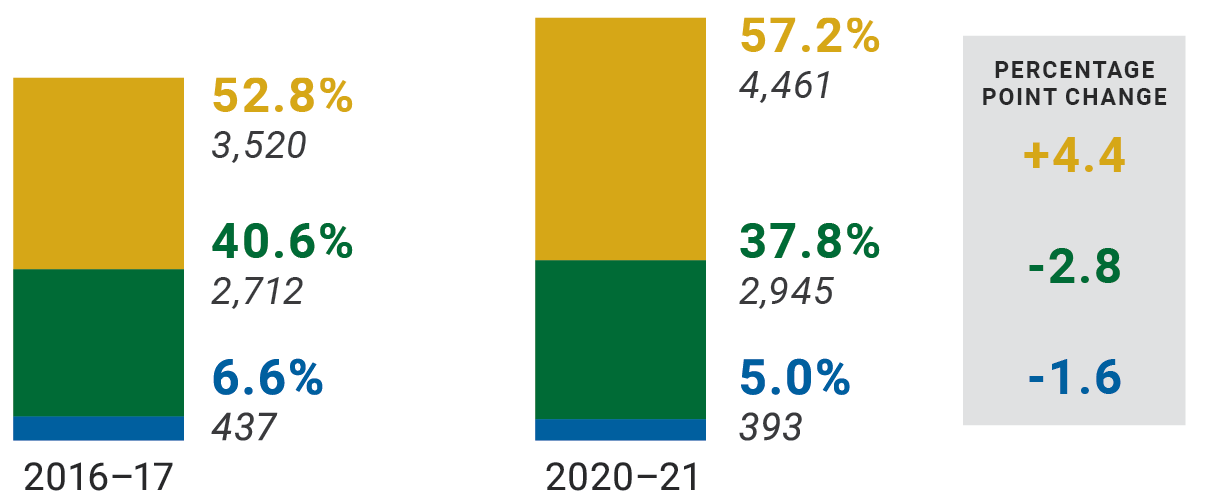
From 2016-17 to 2020-21, the proportion of graduates ages 24 and under increased from 53 to 57 percent. The proportion of graduates ages 25 to 44 decreased from 41 to 38 percent during this period.

24 & Under

25-44

45 & Over
NOVA GRADUATES BY RACE
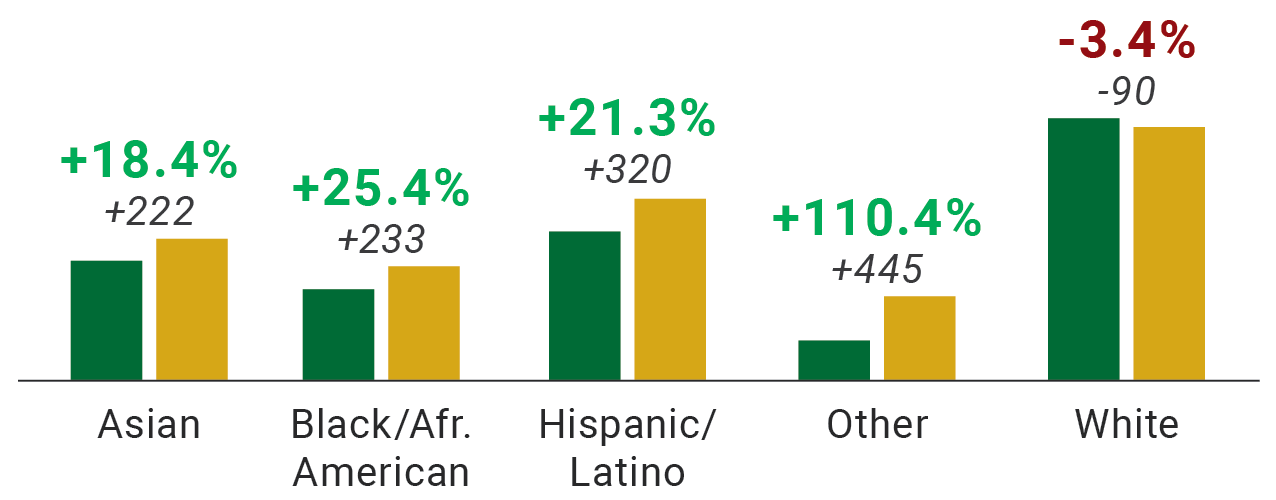
From 2016-17 to 2020-21 at NOVA, the number of Black/African American graduates increased 25 percent. The number of Hispanic/Latino graduates increased 21 percent. The number of Asian graduates increased 18 percent. The number of White graduates decreased 3 percent.

2016-17

2020-21
Note: The Other category consists of American Indian/Alaska Native, Native Hawaiian/Other Pacific Islander, Not Specified, Two or More Races, and Unknown. As of 2020-21, it also includes Nonresident Aliens.
GRAD RATES AT NOVA AND PEER INSTITUTIONS
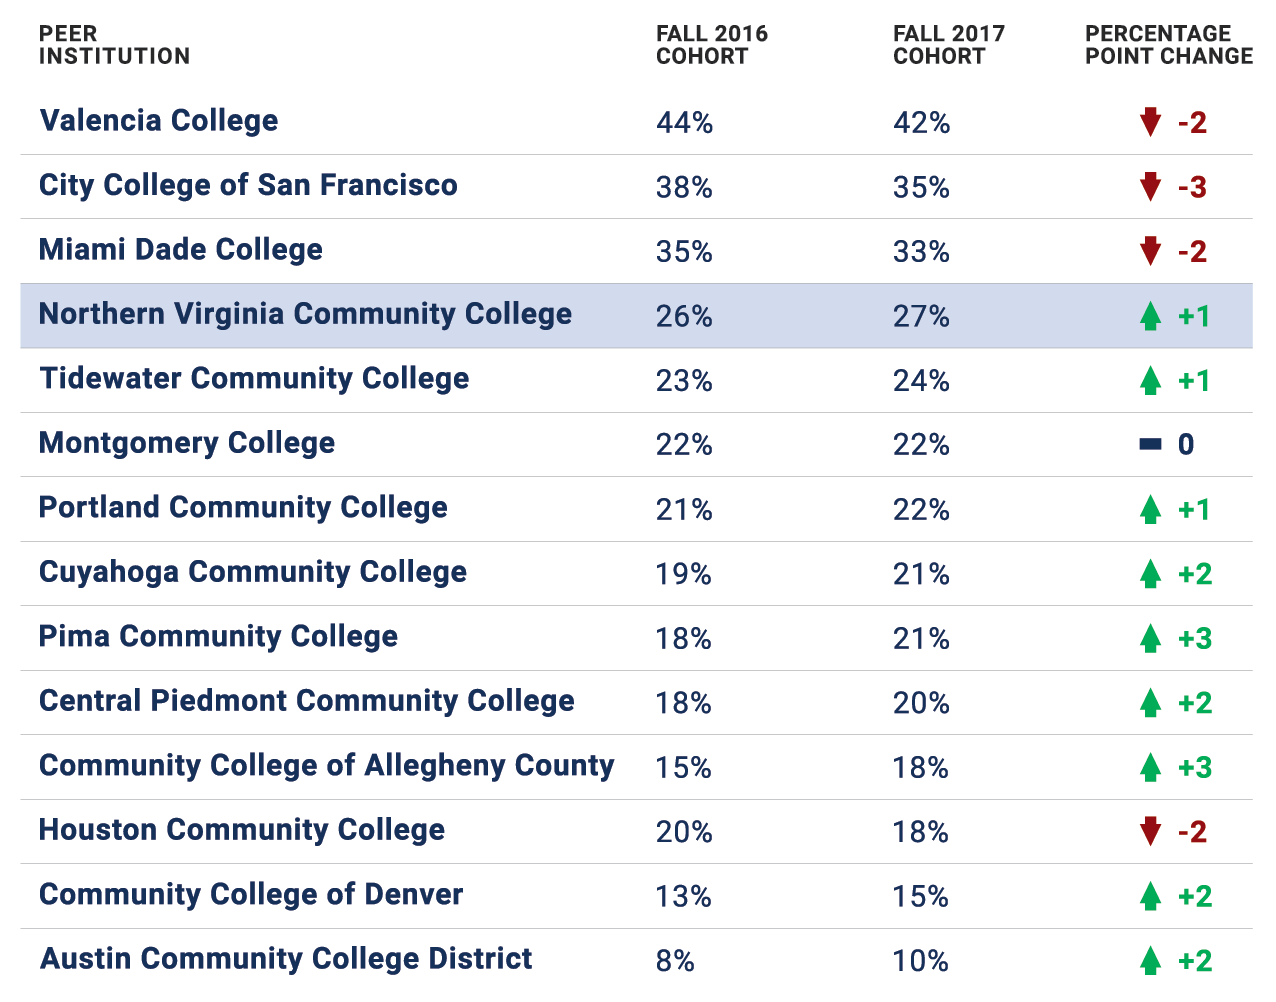
When compared with peer institutions, NOVA ranked fourth in graduation rates for all students in the Fall 2017 cohort. The graduation rate at NOVA increased by 1 percentage point from the Fall 2016 cohort to Fall 2017 cohort.7 Peer institutions are selected for comparative analysis and benchmarking of institutional qualities. Peers have common qualities such as level of resources, student headcount, and institutional goals. Carnegie classification is one of the criteria often used in identifying a peer institution.8, 9 The current list of NOVA’s peer institutions is posted on the Office of Strategic Insights’ website.10
Citations
- Manpower Demonstration Research Corporation (MDRC). (2021). CUNY ASAP doubles graduation rates in New York City and Ohio.
- Jenkins, D., Brown, A. E., Fink, J., Lahr, H., & Yanagiura, T. (2018). TBuilding guided pathways to community college student success: Promising practices and early evidence from Tennessee. . Columbia University, Teachers College, Community College Research Center.
- National Center for Education Statistics (NCES). (2020). Annual Earnings. The Condition of Education.
- NOVA Northern Virginia Community College’s Student Achievement Data. Graduates include first-time in college, full-time, program placed students who graduated within 150 percent of normal time to program completion, including summer.
- NOVA U.S. Department of Education, National Center for Education Statistics, Integrated Postsecondary Education Data System (IPEDS), Graduation Rates component final data (2002 – 2019) and provisional data (2020).
This is based on 910 institutions, limited by sector of institution.
- Northern Virginia Community College (NOVA) Fact Book 2017-2018 through 2021-22.
- Integrated Postsecondary Education Data System (IPEDS).
- Ward, Janet. (2006, July). Identifying Peer Institutions: Utilizing the New Carnegie Classifications and Other Web Resources. PACROA.
- The Carnegie Classification of Institutions of Higher Education.
- NOVA Office of Strategic Insights.
- Manpower Demonstration Research Corporation (MDRC). (2021). CUNY ASAP doubles graduation rates in New York City and Ohio.
- Jenkins, D., Brown, A. E., Fink, J., Lahr, H., & Yanagiura, T. (2018). TBuilding guided pathways to community college student success: Promising practices and early evidence from Tennessee. . Columbia University, Teachers College, Community College Research Center.
- National Center for Education Statistics (NCES). (2020). Annual Earnings. The Condition of Education.
- NOVA Northern Virginia Community College’s Student Achievement Data. Graduates include first-time in college, full-time, program placed students who graduated within 150 percent of normal time to program completion, including summer.
- NOVA U.S. Department of Education, National Center for Education Statistics, Integrated Postsecondary Education Data System (IPEDS), Graduation Rates component final data (2002 – 2019) and provisional data (2020).
This is based on 910 institutions, limited by sector of institution. - Northern Virginia Community College (NOVA) Fact Book 2017-2018 through 2021-22.
- Integrated Postsecondary Education Data System (IPEDS).
- Ward, Janet. (2006, July). Identifying Peer Institutions: Utilizing the New Carnegie Classifications and Other Web Resources. PACROA.
- The Carnegie Classification of Institutions of Higher Education.
- NOVA Office of Strategic Insights.


