Purpose
To determine the stiffness of a spring.
Objectives
- To learn how to apply Hooke’s Law to elastic springs.
- To learn how to use the formula for the period of a Simple Harmonic Oscillator.
- To learn how to apply linear regression to experimental data in order to improve the accuracy of the final result.
- To learn how to compare two independently obtained experimental values for the same quantity.
- To learn how to determine the significant digits with which the final result is reported.
Theory
Hooke’s Law relates the elastic force of a spring to its compression/stretching:

When we hang a block with mass m on a vertical spring, it stretches until the elastic force cancels the gravitational pull on the block. For the magnitude of the two forces, then, we have

If we measure the mass and the stretching of the spring, we can use the formula above to determine the stiffness of the spring.
The stiffness of the spring also affects the period of oscillations that the block undergoes when displaced from equilibirum:

Activity 1. Determine the spring stiffness by using Hooke’s Law.
Data Analysis
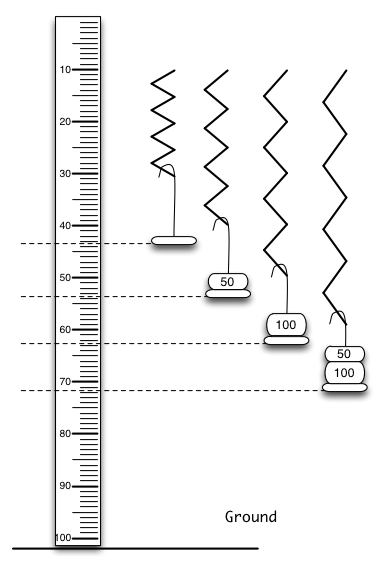
Measure the stretching of the spring as you place 50 g, 100 g, 150 g, 200 g, and 250 g onto the 50-g hook. Record your data in a spreadsheet table and plot the stretching in meters as a function of the hanging mass in kilograms.
Questions.
- Do you get a straight line?
- What is the value for the slope of the line that fits best your experimental data? (Use linear regression to determine the slope of the graph. How to get the slope in google sheets)
- Using the value for the slope of the best fit line, determine the stiffness of the spring
Activity 2. Determine the spring stiffness by using the formula for the period of a simple harmonic oscillator.
For each of the 50-g, 100-g, 150-g, 200-g, and 250-g weights, place one onto the 50-g hook, pull the mass about 5 cm from its equilibrium and let it oscillate up and down. Measure the period of oscillations.
Note! The spring’s mass influences the period of harmonic oscillations. In order to account for the spring effect, add 1/3 of its mass to the hanging mass so that

Note! In order to improve the accuracy of the measurement for the period, measure the time for 20 oscillations and then calculate the period as 
Record your measurements for period in a spreadsheet table and plot the square of the period, 

Questions
- Why do you need to plot
as opposed to simply plotting
vs.
- What kind of graph do you get for the
- What is the slope of the least-square linear fit for your plot?
- Determine the spring stiffness from the slope of your graph.
Comparison of the results from Activity 1 and Activity 2.
Questions
- To what digit do the two results for the stiffness agree?
- What is the percent difference between the two values?
- With how many digits will you report both values for the stiffness in your final results?