The NOVA library staff helps students learn about career options that suit their skills and interests. Over the past few years, we’ve noticed a significant number of students exploring careers involving data: Data scientist, data analyst, data architect, data engineer, and more.
As we progress towards a data economy, data literacy is becoming increasingly important in the workplace, no matter your profession. Gartner predicts that “by 2023, data literacy will become essential in driving business value.”
In the 21st Century, everyone needs a certain level of data literacy competence. Everyone consumes data (discrete stats) as they read news articles or blog posts. Sometimes data are mentioned in the text; other times presented in a chart or graph. At some point, most of us will have to compile data from multiple sources. To accomplish this, we’ll all need to master:
- When to use mean or medium, averages or ranges, frequencies or percentages
- How to distinguish correlation from causation
- Determine when it’s appropriate to use a pie or bar chart, line or clustering graph
- Where to find (and how to cite) data/statistics.
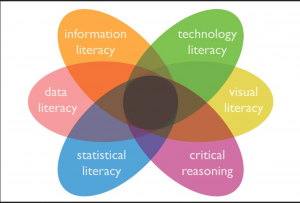
What is data literacy?
Statistical literacy is the ability to read and interpret numeric information, whether presented in text, table, or graphic format. “Gartner defines data literacy as the ability to read, write and communicate data in context, including an understanding of data sources and constructs, analytical methods and techniques applied, and the ability to describe the use case, application and resulting value.”
Data literate individuals can find, evaluate, analyze, use, and create data, statistics, and visualizations responsibly. It’s important to not only be a good data consumer—critically assessing the data presented—but be able to communicate data by putting it into context for others. In addition to reading and working with data, one must be effective when communicating data, including responsibly reporting the results of a study and presenting these results in tables and graphics to make data digestible and easy to understand.
Data literacy includes the ability to:
- Assess data sources and collection methods
- Provide context for raw numbers via tables, charts, and graphs
- Tell a story through data.
Ethical use of data includes not cherry-picking data to offer in support of a hypothesis, using a scale proportionate to the data, i.e., not manipulating the y axis of a graph.
Data literacy resources at the NOVA libraries
The books in our collection are shelved according to the Library of Congress (LC) classification scheme. All books about data are shelved using the call number QA76.9; those about statistics use QA276. If you’re not in the library and want to access an e-book on data or statistics, go to our homepage and type the call number (QA76.9 or QA276) into the search box. Our catalog will reveal the titles you have access to online via our library subscriptions. If you happen to be in another library that uses the LC classification scheme, you’ll know which shelf to peruse there too.
Additional resources
Academic librarians point students to creditable resources covering coursework delivered at their institutions. The Nelson Poynter Memorial Library, University of South Florida St. Petersburg Campus has created a Data Literacy Teaching Toolkit, replete with instructional activities and resources for faculty to use as they teach data literacy skills.
In its Science and Information Literacy Resources Guide, the Association of College and Research Libraries (ACRL) has devoted a section to Data Information Literacy Resources and Publications. Individual institutions have created Resource Guides, such as Rutgers University Libraries Data Literacy and University Libraries, Washington University in St. Louis Data Literacies.
If you want to learn more about creating elegant and impactful visuals, take a look at the resources available on the Information is beautiful website. Another fun site to check what’s wrong with so many graphics is Junk Charts. Finally, as journalists often have to create their own charts, there’s a resource that they use, The Journalists’ ToolBox.
How data literate are you?
When reading a news article or research study, can you assess data sources and collection methods? Put your data literacy to the test at https://thedataliteracyproject.org/assessment.
If you could use a refresher, the video tutorials from Eastern Michigan University librarians provide an overview of data literacy and some of the elements discussed in this blog, such as:
Finally, DataProfessor created a series of data science videos in 2020 on YouTube. He also points you to other data scientist videos so that you can access “the best.” Check them out.