Newton’s Second Law
Purpose
To determine the acceleration of an object sliding down a ramp.
Objectives
- To learn how to use equipment for automated data acquisition.
- To learn how to organize data.
- To learn how to plot data and analyze it using statistical methods.
- To learn how to determine physical quantities graphically.
Equipment
- Air pump and air track with a glider
- Pasco Mechanical Kit
- One photogate to connect to Pasco 850 Interface
- Ruler or calipers
Pre-lab Activity
Derivation of the acceleration
 An object with mass M glides frictionlessly along a horizontal track. It is connected to a hanging object with mass m through a cord and a pulley as shown on the diagram. Determine the acceleration of the gliding object in the absence of friction.
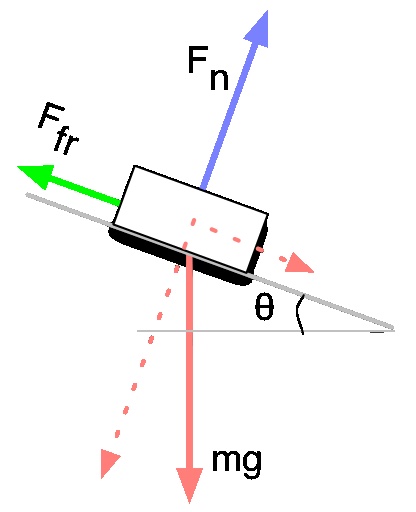
Question 1. What will be the acceleration if friction was present and the coefficient of kinetic friction is μ ?
Theory
In the absence of friction, the acceleration of the glider in the diagram above is given by the formula:

where M is the mass of the glider, and m is the mass of the hanging object.
Preliminary Setup
Experimental Setup
Things to watch:
- The air track must be level!
- The photogate must blink each time a black tape portion goes through
Activity. Determine the acceleration of the glider.
- Set the glider along the track above the photogate.
- Turn on the air pump to level 3 and set the Pasco Software to record measurements
- Let the glider move down the track through the photogate and stop the measurements.
- Using the Pasco Software, graph the velocity vs. time measurements. Use linear fit to determine the least-square fit line and find its slope.
- The slope of that graph is the acceleration of the glider.
Compare the theoretical prediction with your results for the acceleration
- Use the theoretical formula and calculate the acceleration of an object sliding down an incline track
- Compare the theoretical value with your experimental result
Question: What is the percent difference between the two values?
Analysis and Assignments
If you have a large discrepancy between the measured and the calculated acceleration work on A1. below. If your measured and calculated values for the acceleration agree to within 5% or less, work on A2. below.
A1. (Only if you have large discrepancy between the measured and calculated values for the acceleration). Check whether any of the following factors can be accountable for the discrepancy:
- Check your calculations for the theoretical value of the acceleration.
- Incorrect slope. Level the track again and re-rerun the experiment.
- Photogate. Let the glider through the photogate and make sure the photogate blinks properly. There should be a blink (only one) for each blackened space along the picket fence.
- Presence of friction. Increase the Air Pump level to 5 or higher and re-run the experiment.
- Using heavier or lighter hanging mass and re-run the experiment.
Question: Which of the following factors affected your measurements?
Question: Were you able to obtain better results and improve the agreement between the experimental and theoretical value?
A2. (Only if your experimental and theoretical values for the acceleration agreed within 5%). Repeat the experiment for a different hanging mass.
The theoretical acceleration is
