copyright 2002, 2019 Elizabeth C. Lanthier, Ph.D.
Purpose
The correlation is a way to measure how associated or related two variables are. The researcher looks at things that already exist and determines if and in what way those things are related to each other. The purpose of doing correlations is to allow us to make a prediction about one variable based on what we know about another variable.
For example, there is a correlation between income and education. We find that people with higher income have more years of education. (You can also phrase it that people with more years of education have higher income.) When we know there is a correlation between two variables, we can make a prediction. If we know a group’s income, we can predict their years of education.
Direction
There are two types or directions of correlation. In other words, there are two patterns that correlations can follow. These are called positive correlation and negative correlation.
Remember that in a correlational study, the researcher is measuring conditions that already exist. She or he is asking questions of a sample of participants, and finding out in what way pairs of variables are related. For example, a researcher could ask about the participants’ yearly income and years of education, to see if those two attributes are correlated.
Positive correlation
In a positive correlation, as the values of one of the variables increase, the values of the second variable also increase. Likewise, as the value of one of the variables decreases, the value of the other variable also decreases. The example above of income and education is a positive correlation. People with higher incomes also tend to have more years of education. People with fewer years of education tend to have lower income.
Here are some examples of positive correlations:
- SAT scores and college achievement—among college students, those with higher SAT scores also have higher grades
- Happiness and helpfulness—as people’s happiness level increases, so does their helpfulness (conversely, as people’s happiness level decreases, so does their helpfulness)
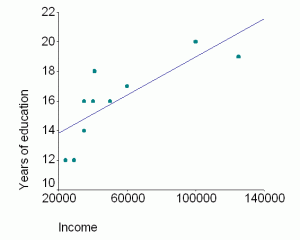
This table shows some sample data. Each person reported income and years of education.
| Participant | Income | Years of Education |
| #1 | 125,000 | 19 |
| #2 | 100,000 | 20 |
| #3 | 40,000 | 16 |
| #4 | 35,000 | 16 |
| #5 | 41,000 | 18 |
| #6 | 29,000 | 12 |
| #7 | 35,000 | 14 |
| #8 | 24,000 | 12 |
| #9 | 50,000 | 16 |
| #10 | 60,000 | 17 |
In this sample, the correlation is .79.
We can make a graph, which is called a scatterplot. On the scatterplot below, each point represents one person’s answers to questions about income and education. The line is the best fit to those points. All positive correlations have a scatterplot that looks like this. The line will always go in that direction if the correlation is positive.

Negative correlation
In a negative correlation, as the values of one of the variables increase, the values of the second variable decrease. Likewise, as the value of one of the variables decreases, the value of the other variable increases.
This is still a correlation. It is like an “inverse” correlation. The word “negative” is a label that shows the direction of the correlation.
There is a negative correlation between TV viewing and class grades—students who spend more time watching TV tend to have lower grades (or phrased as students with higher grades tend to spend less time watching TV).
Here are some other examples of negative correlations:
- Education and years in jail—people who have more years of education tend to have fewer years in jail (or phrased as people with more years in jail tend to have fewer years of education)
- Crying and being held—among babies, those who are held more tend to cry less (or phrased as babies who are held less tend to cry more)
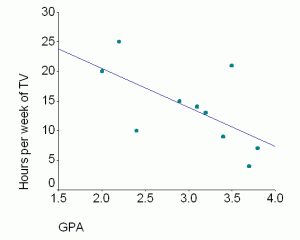
We can also plot the grades and TV viewing data, shown in the table below. The scatterplot below shows the sample data from the table. The line on the scatterplot shows what a negative correlation looks like. Any negative correlation will have a line with that direction.
| Participant | GPA | TV in hours per week |
| #1 | 3.1 | 14 |
| #2 | 2.4 | 10 |
| #3 | 2.0 | 20 |
| #4 | 3.8 | 7 |
| #5 | 2.2 | 25 |
| #6 | 3.4 | 9 |
| #7 | 2.9 | 15 |
| #8 | 3.2 | 13 |
| #9 | 3.7 | 4 |
| #10 | 3.5 | 21 |
In this sample, the correlation is -.63.

